
About ACCTee Pro
For surface, contour and form measurements, there is one software that covers everything: ACCTee PRO. An easy-to-use menu-guided user interface, automatic functions, wizards and help functions make it especially easy for beginners and experts alike to work with ACCTee PRO. Data analysis is made even faster by the playback function at the push of a button and re-evaluation.
Automatic Pass/Fail Judgement (JIS2001 Standard)
In the ACCTee analysis process, the 16% rule and the max rule are standardized for the tolerance criteria of the roughness evaluation parameters. With the 16% rule, if the measurement value for the multiple standard length that exceeds the tolerance is below 16%, it is assumed to pass. With this rule, values must not exceed allowable tolerance.
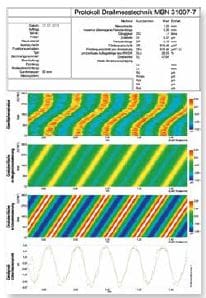
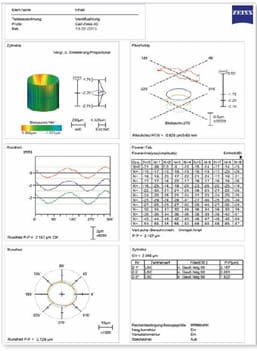
3D Roughness Measurement and Analysis
Functions support 3D roughness analysis. (Optional expanded hardware required) It is possible to obtain up to 4000 scanning lines and 80 million data. 3D analysis can be performed with versatile visual displays.
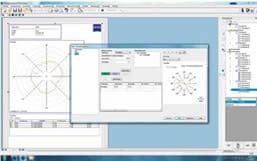
Change Analysis Conditions - With a Preview
With ACCTee, you can set and change the roughness parameter calculation standard, cutoff filter, notch level, deletion length and other conditions. The range of the waveform data used for the roughness parameter calculation can be set to any value. The preview function also allows you to optimum form remove (tilt correction) can also be selected. The specified area and conditions can be cleared and changed quickly and easily.
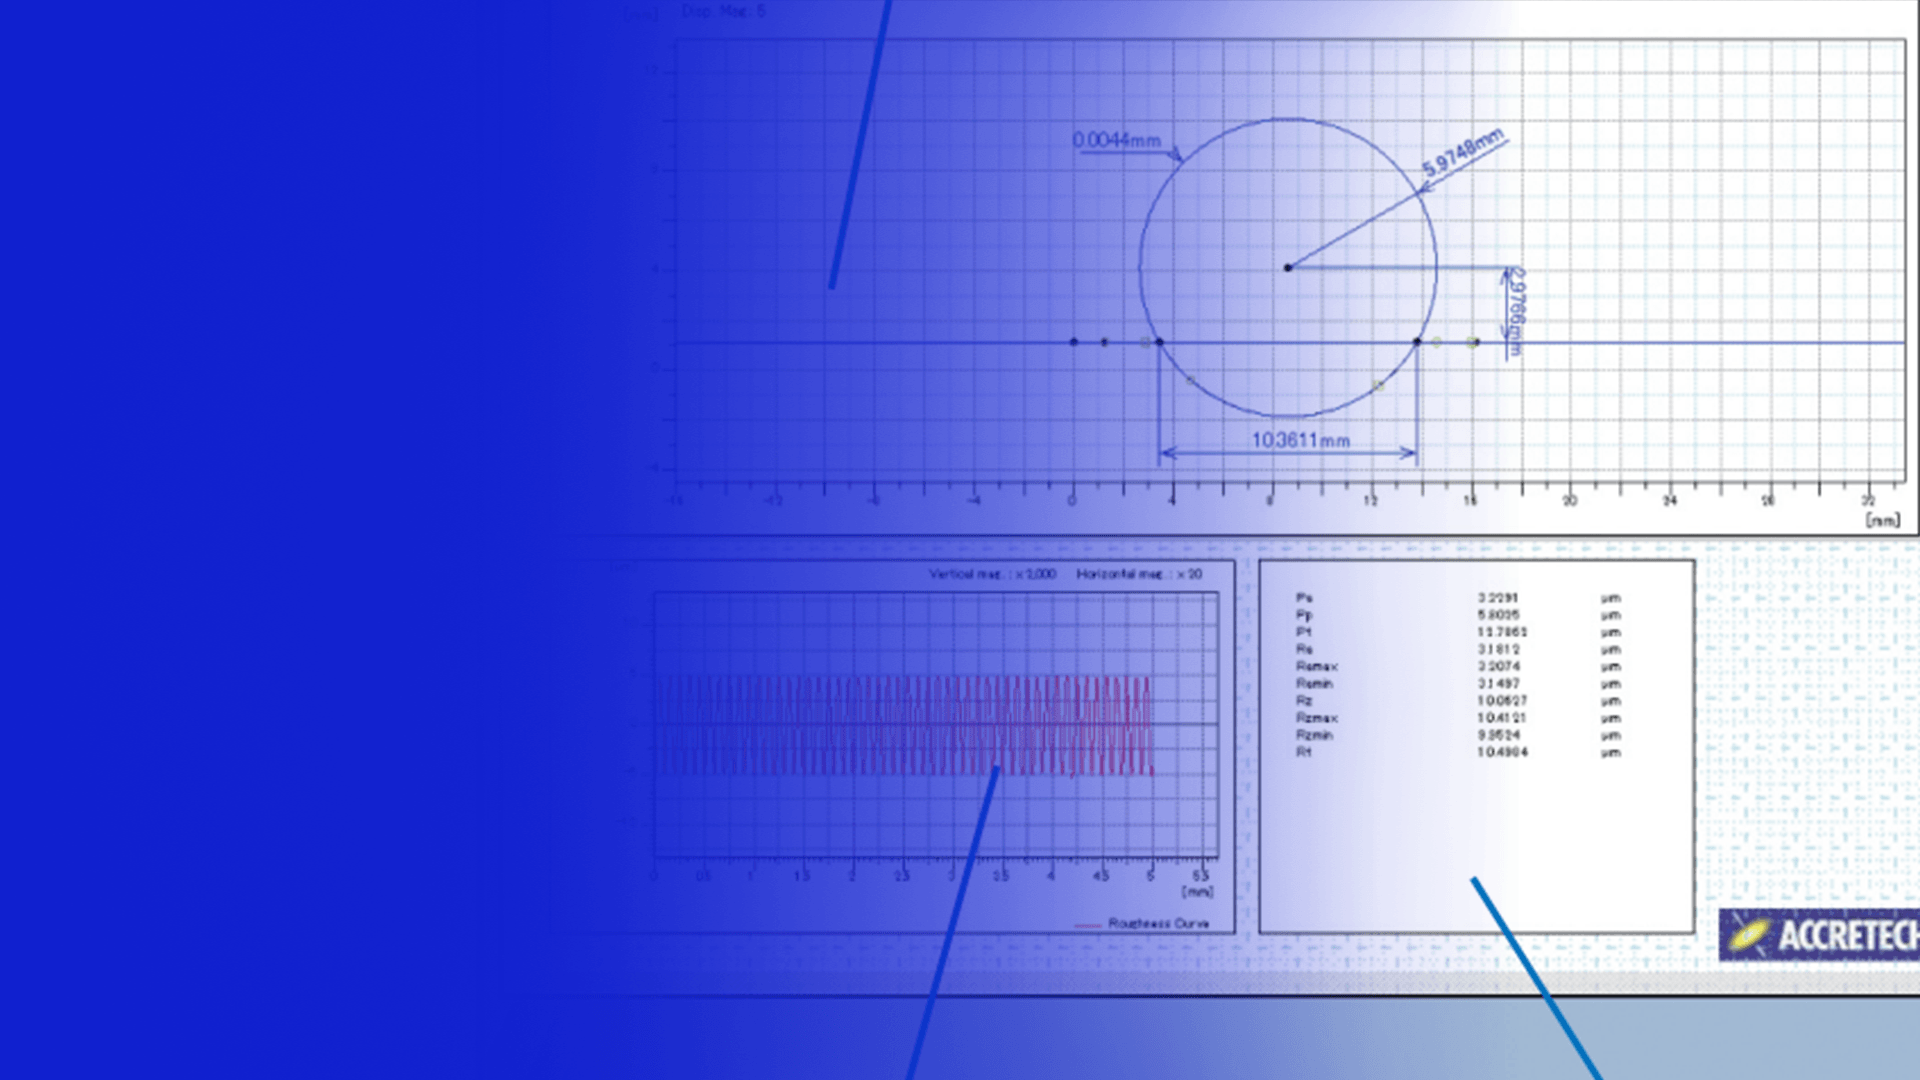
Roughness Peak and Valley Detection
ACCTee detects the maximum point (minimum point) and automatically shifts the stylus to the maximum point (minimum point) as the peak and valley function traces the cylindrical profile, convex, concave, and spherical profile using the stylus.